Q4 Phoenix Industrial Market Report
PHOENIX INDUSTRIAL MARKET
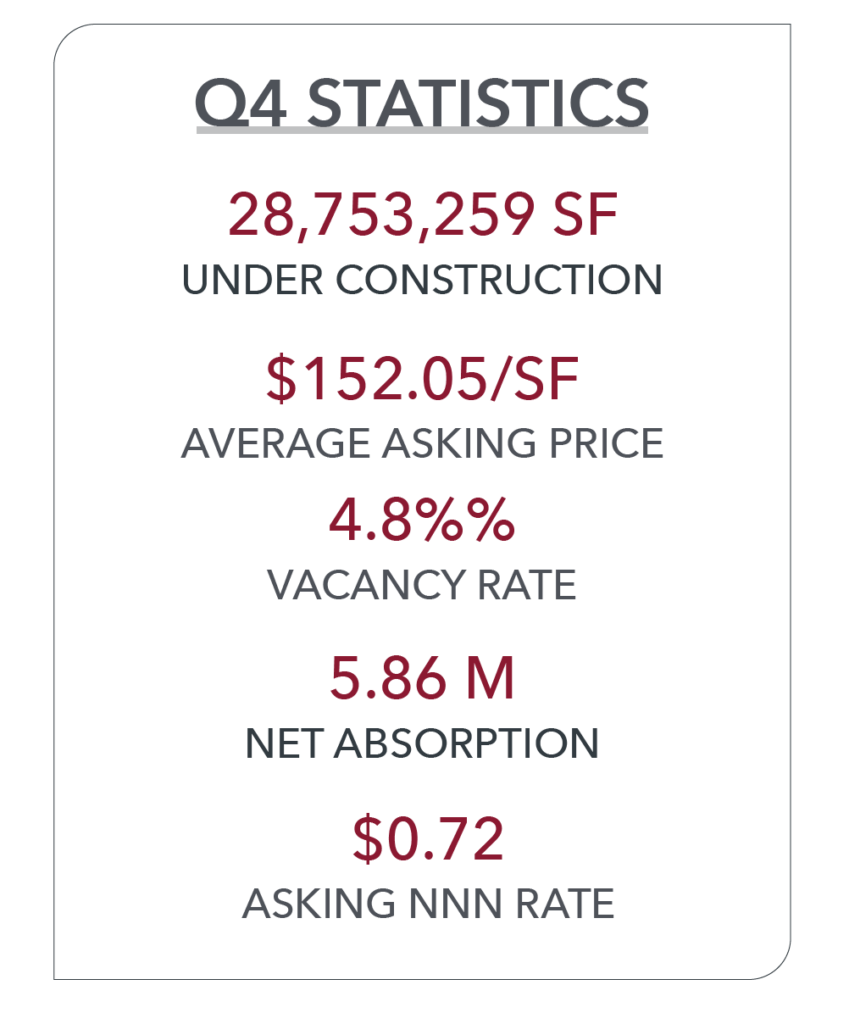
The Phoenix Industrial Market completed another year with historically low vacancy rates and net absorption levels, and more product under construction than ever before. The Phoenix Market absorbed 22 million square feet in 2021, nearly three times the 10-year average, dropping the vacancy down to 4.8% overall. There were roughly 28 million square feet of industrial buildings under construction at the end of the year with appropriately 5 million square feet, or 17% being pre-leased or built to suit.
User demand continued to drive the Industrial Market throughout the year. Phoenix had national credit tenants Lowe’s, Williams Sonoma, Home Depot, Walmart and MLILY all sign leases for over 1 million square feet. Net absorption continued to increase at levels never seen before as construction raced to keep up. Q4 had 5.86 million square feet of net absorption bringing the annual total to over 22 million, a 38% increase from the record 14 million square feet of net absorption recorded in 2020.
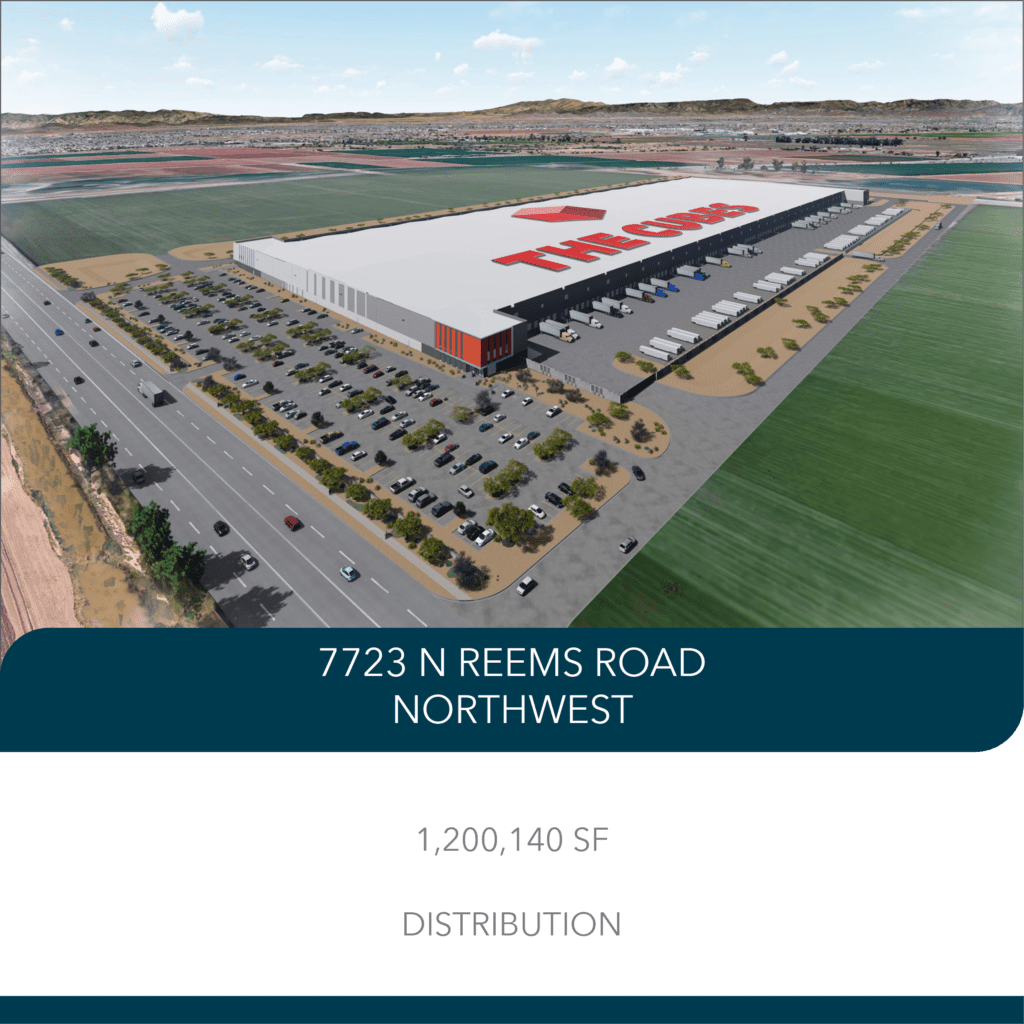
New construction continued to increase to new levels. Metro Phoenix finished in the top five for new construction with over 28 million square feet underway at the end of 2021. The largest projects under construction in Q4 were the first phase Creation Equity’s Airpark Logistics Center, a 2.7 million square foot multi-building development in Goodyear and CRG’s The Cubes Glendale at 1,200,140 square feet.
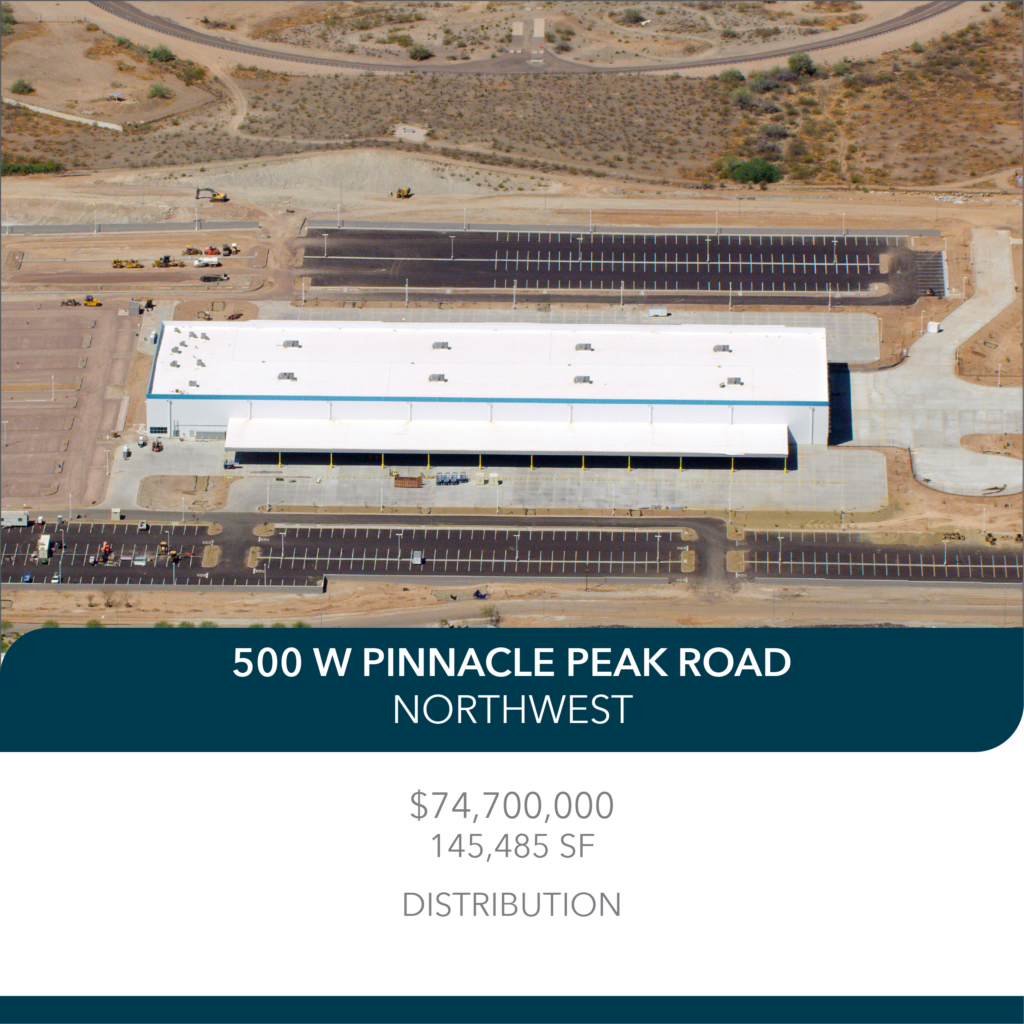
Buyer confidence remained high as Q4 recorded $1.7 billion in sales volume, pushing the annual total to over $5.3 billion, which is more than 2019 and 2020 combined. Lack of inventory and buyer competition put upward pressure on pricing with sales prices averaging an all-time high of $152.05/SF. There were 242 sale transactions in Q4, on pace with the 248 transactions for Q3.
The Phoenix Industrial Market continues to thrive with the low cost of doing business, talented employment pool, and a government friendly business environment. Phoenix has been one of the most resilient markets during the pandemic, setting records over the last couple years and is showing no signs of a slow-down.
SUBMARKET STATISTICS
| SUBMARKET | TOTAL INVENTORY | VACANCY TOTAL SF | VACANCY PERCENTAGE | Q4 NET ABSORPTION | YTD NET ABSORPTION | UNDER CONSTRUCTION SF | ASKING NNN RATE | |
| Sky Harbor | 49,361,852 | 1,480,723 | 3.0% | 190,679 | 1,143,375 | 207,701 | $0.78 | |
| Northeast Valley | 14,878,792 | 403,607 | 2.7% | 32,058 | 297,576 | – | $1.08 | |
| Northwest Valley | 73,786,008 | 3,230,127 | 4.4% | 2,764,566 | 7,262,186 | 11,914,385 | $0.66 | |
| Southeast Valley | 96,758,930 | 4,052,127 | 8.0% | 815,048 | 108,960 | 7,740,324 | $0.78 | |
| Southwest Valley | 110,821,132 | 8,146,544 | 8.0% | 758,457 | 8,101,998 | 8,890,849 | $0.52 | |
| TOTALS | 345,606,714 | 16,482,356 | 4.8% | 5,863,242 | 5,863,242 | 28,753,259 | $0.72 |
TOP INDUSTRIAL LEASES
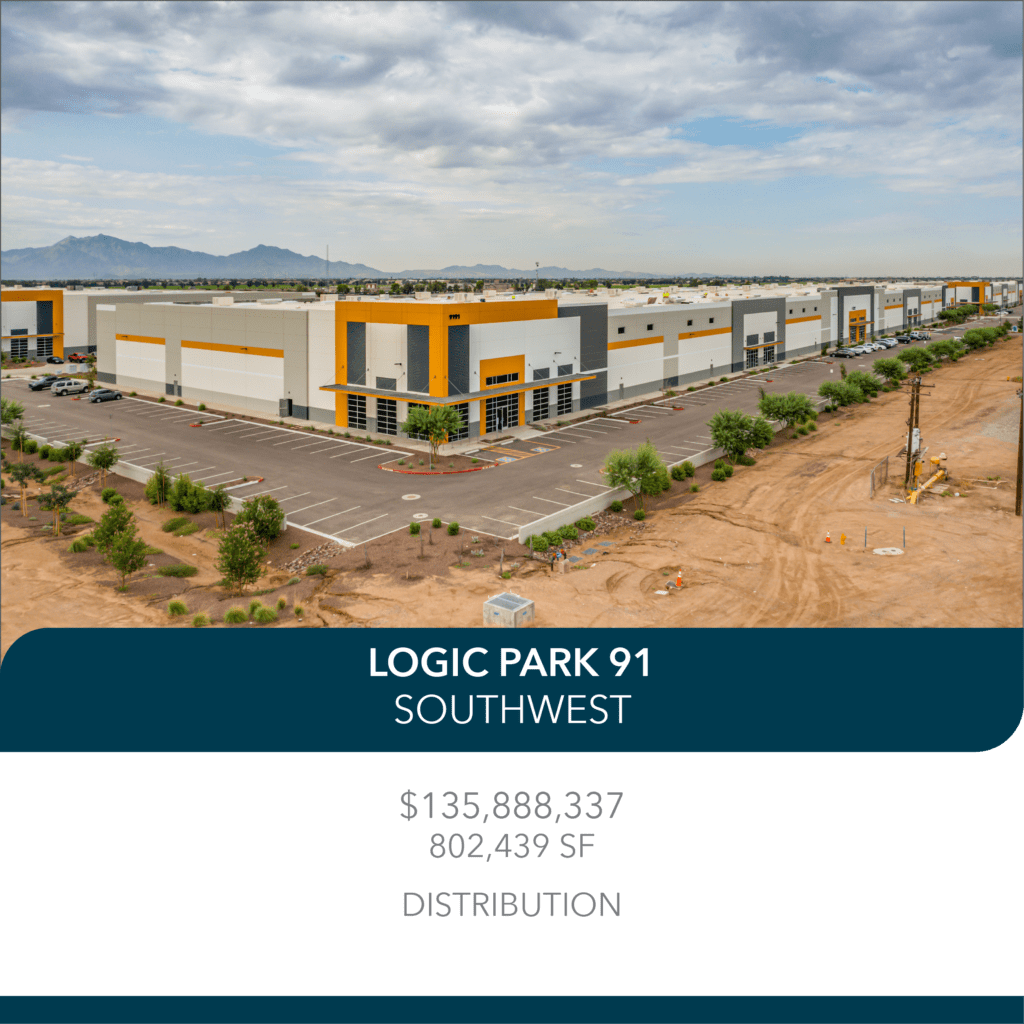
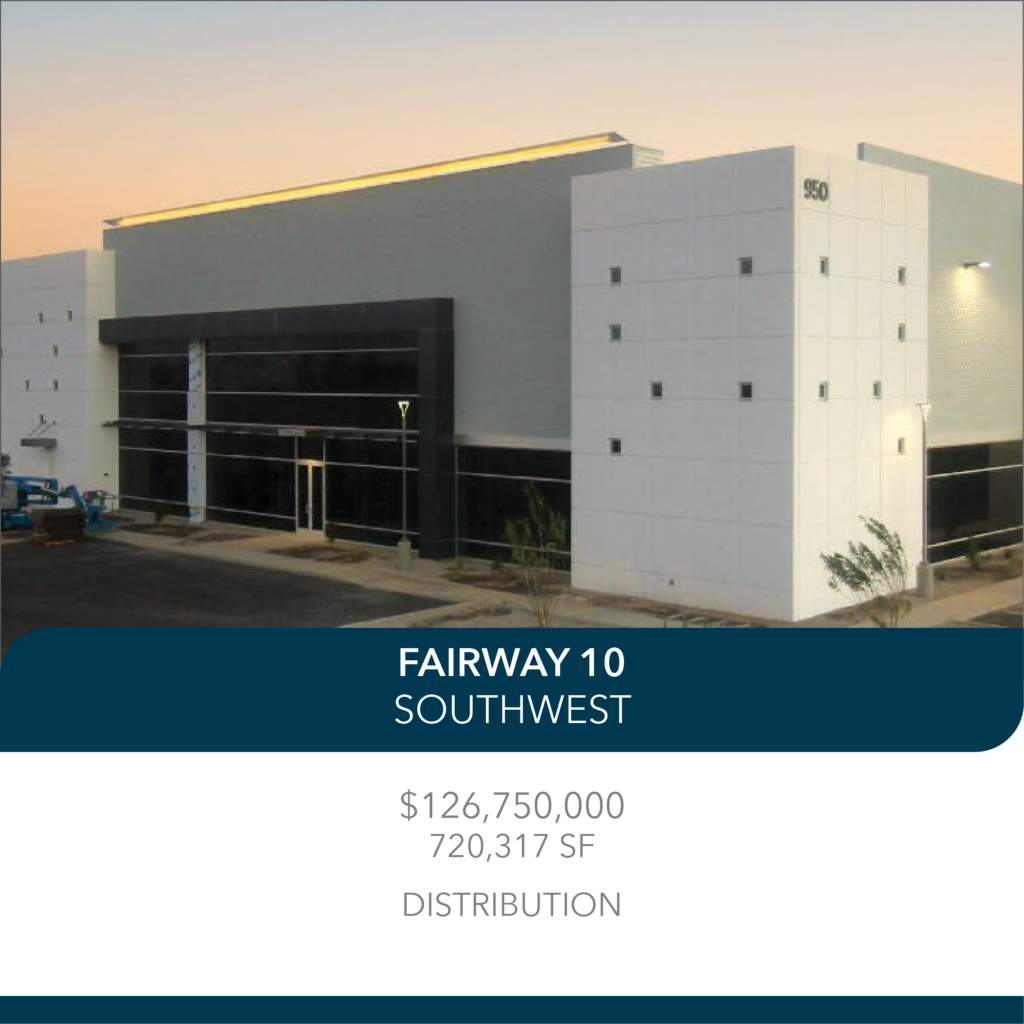
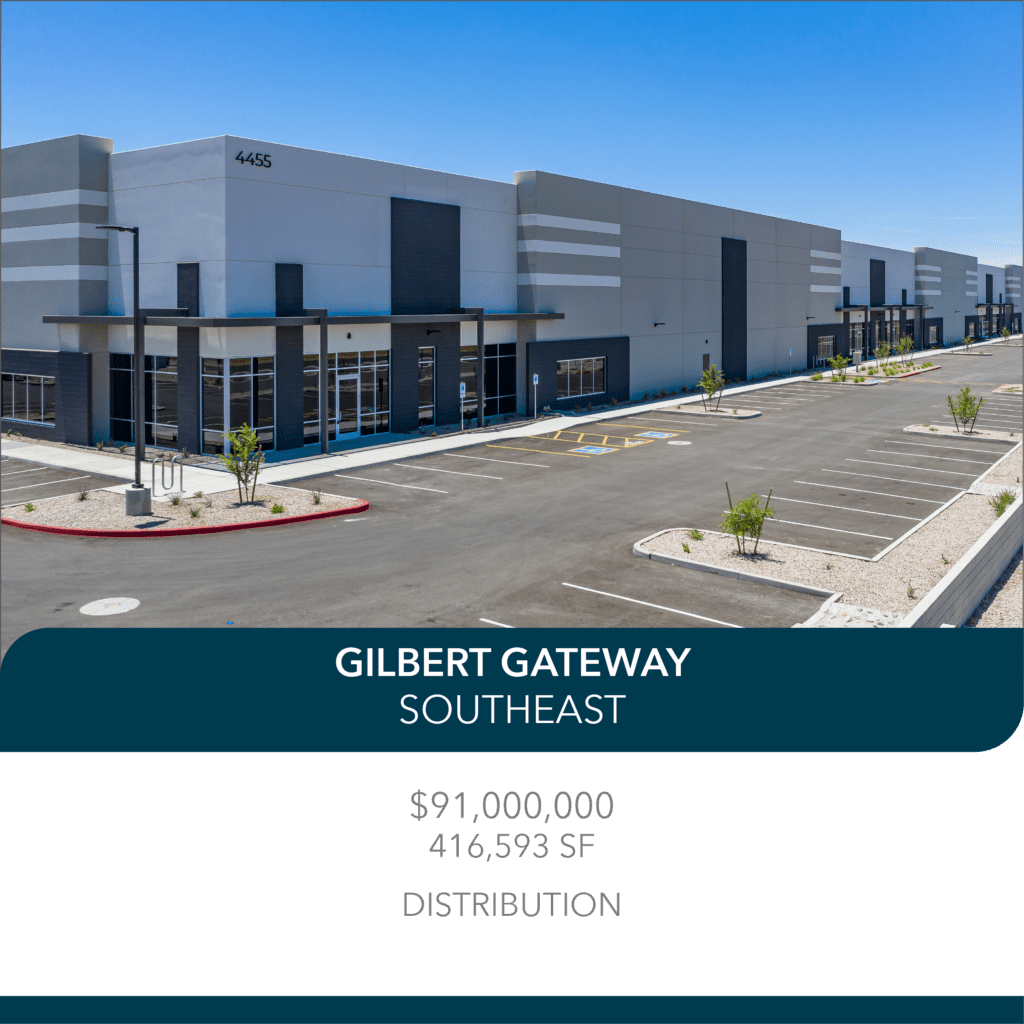
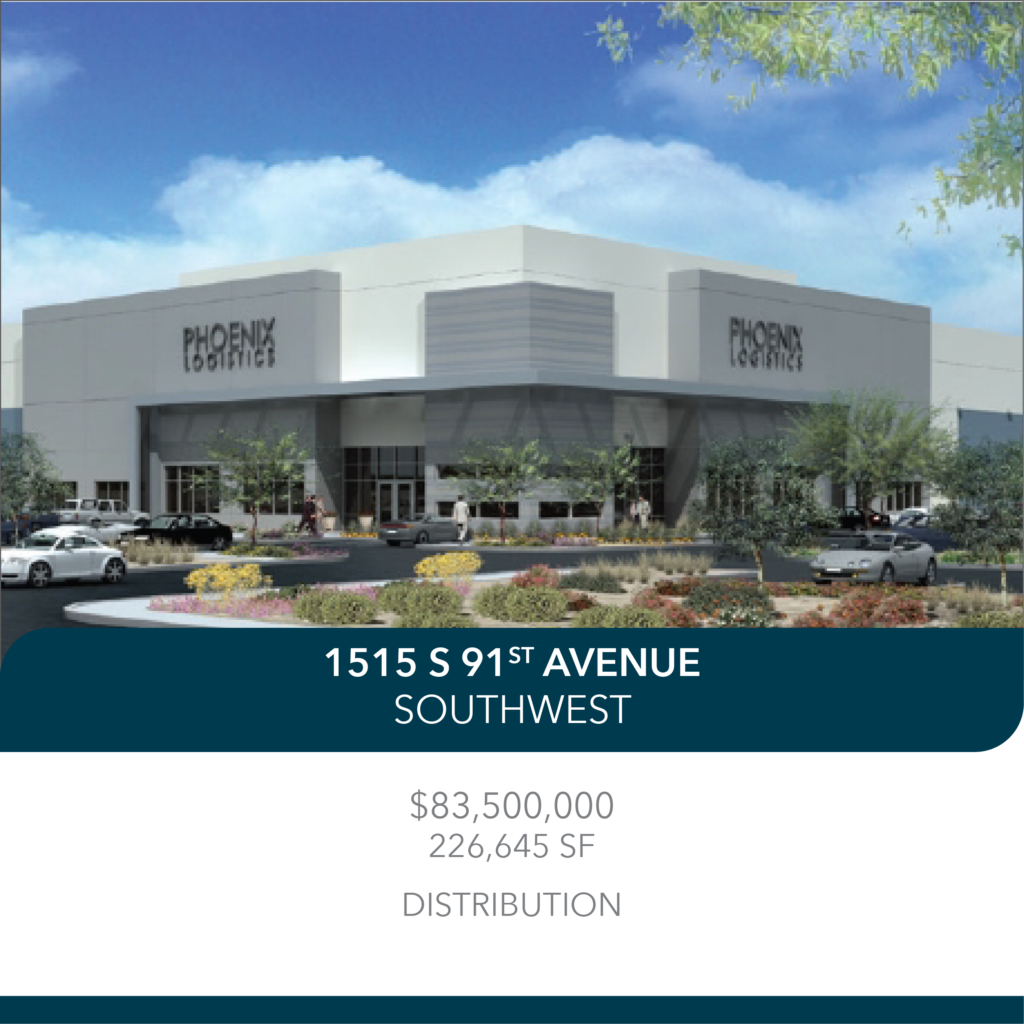
TOP INDUSTRIAL SALES